THE BARATELLI INSTITUTE
· Mentoring at Scale
Home
THE BARATELLI INSTITUTE
· Mentoring at Scale
THE BARATELLI INSTITUTE
· Mentoring at Scale
Home
THE BARATELLI INSTITUTE
· Mentoring at Scale
Every quarter, a river of cash shows up to join the ocean of cash already there. What are good ideas for investing that ocean of cash?
Our current answer — buying NBCU for $70 billion to start a Disney clone is a bargain →
Practitioner reads on Berkshire Hathaway’s positions, deals, and annual-letter signals.
Authored by Philip A. Baratelli, CPA, MBA. Former Family Office CFO and public-company CFO; corporate controller and treasurer in earlier roles. Currently a Principal, investing on his own behalf. Owns BRK.B personally; does not advise on Berkshire, TMHC, or any other security.
When Berkshire deploys capital, the Institute publishes the practitioner read when the analysis is ready — deal mechanics, price discipline, library tie-back. Cases ship when they stand up to the depth every other Berkshire Read holds to. We’d rather be late and right than fast and shallow. Hypotheticals test the pattern against named, ranked candidates at the same flagship depth.
Berkshire Read is the Baratelli Institute’s recurring practitioner read on Berkshire Hathaway — the deals, the equity-stake changes, the annual-letter signals. Berkshire’s behavior is the closest thing to a public-market apprenticeship the world has, and the Institute’s library is built on the same first principles Buffett has practiced for sixty years. Cases walk an actual Berkshire move with a 30+ page case study, a 10-tab Excel model, a Library Crosswalk, a presentation deck, and a single combined PDF. Strategic Briefs pair to each case as hypothetical analytical exercises — named, ranked Berkshire candidates tested against the same five-fingerprint pattern, with the discipline banner that distinguishes documented fact from Institute-hypothesized structure from Buffett-pattern inference.
Every Berkshire Read piece ties back to the Institute guides that supply the methods — the CFO & Controller’s Reference Guide, the Private Equity Guide, the Business Buyers Guide, First Principles of Master Investing, and the Liquidity Event Playbook. The case and the crosswalk are free. The full work package — with the Excel model and the deck — is the public-good piece of the Institute’s practitioner-shelf project. For the method underneath every read — how a single entry produces six different numbers, one per audience — see The Six Lenses.
Where Berkshire Read walks the deals Berkshire actually did, the Operator’s Chair runs the hypotheticals — the acquisition lenses we’d hunt through if the capital were ours, each idea graded against the same five Buffett filters. The discipline is the product; the candidates graduate into full case studies.
Comcast's June 29, 2026 announcement to spin NBCUniversal as a tax-free §355 distribution puts a $60-75B integrated entertainment-and-experiences platform inside our addressable set. Under Greg Abel — with BNSF and BHE as the operating template and roughly $300-400 billion of un-deployed cash compounding at T-bill yields — NBCU is the rare opportunity that absorbs meaningful Berkshire capital while opening an entire new investment category. Studios + Streaming + Theme Parks + Sky international + Sunday Night Football reconstructs Disney's architecture in one transaction. The next decade of bolt-ons (Six Flags at cyclical troughs, cruise lines, hotels at REIT-cycle discounts, sports rights at renewal cycles) is what the platform enables. The Institute's editorial position: we would buy NBCU outright if we ran Berkshire.
Copart is one of only two players in a genuine two-sided-network-effect duopoly — the specific rare event Berkshire waits decades for. Moody’s / S&P is the analog. Coca-Cola / Pepsi is the analog. IAA sits inside RB Global; Copart is the only realistic path to own half the salvage-auction duopoly. Founder Willis Johnson is 79. Returning CEO Jay Adair is his son-in-law. Owner earnings capitalized at 20× produce an intrinsic anchor of ~$30 billion; the sum-of-the-parts (owner earnings + real estate at market + cash and Treasuries) produces a central of ~$38 billion against a $27.8 billion market cap. Zero long-term debt; 18.6× TTM P/E on $1.61 EPS. BNSF (2010, ~$44B) and Precision Castparts (2016, ~$37B) are the acquirer precedents at this scale. Two Berkshire-specific drivers — GEICO integration margin capture and international consolidation at Berkshire capital cost — add ~$245M/year of value creation vs. baseline. Recommended: Scenario B at 1.15× (~$32B EV).
Why Berkshire is the natural buyer, if the family ever sells.
Penske Automotive Group (NYSE: PAG) is the third case we make for Berkshire to acquire — and the one where the architecture is already substantially in place. Roger Penske is 89. Berkshire already owns approximately 19% of PAG, a position built patiently over more than a decade that has returned roughly $400 million in cumulative dividends since 2015. The three-entity architecture — PAG (the public consolidator), Penske Corporation (the private family control block), and PTS (the Mitsui joint venture housing truck leasing and logistics) — produces four plausible succession outcomes (status quo continues, family retains, IPO of Penske Corporation, strategic sale), and Berkshire is the natural counterparty in one of them. Post-Mitsui SOTP builds to ~$12.6B in equity value; a strategic sale to Berkshire would require roughly ~$10.2B of fresh capital, net of the 19% already held at cost. The memo does not forecast a sale — it maps the architecture the practitioner shelf should hold in view, and walks the Berkshire-declines counter-case in the same voice as the primary thesis.
An $8.5B all-cash acquisition of a Sun Belt production homebuilder — the largest residential-construction deal in Berkshire history, and the first time Berkshire owns a publicly-listed national homebuilder. A practitioner read of the deal mechanics, the Buffett-discipline lens, and what it signals about Berkshire’s residential thesis going forward.
Berkshire paid a modest 1.08x book value and 6.6x trailing Adjusted EBITDA, all-cash from the ~$397B war chest, for a Sun Belt homebuilder with a 13-year public track record, an aligned owner-CEO (Sheryl Palmer) who stays in the seat, and an asset-light land book (~54% lots controlled off-balance-sheet). The break from Berkshire pattern is the industry; the discipline is textbook. The clearest read is that Greg Abel is signaling a Clayton-Homes-plus-TMHC-plus-HomeServices site-built housing platform, not a one-off opportunistic buy.
Deal terms and multiples as of June 1, 2026 (announcement date May 31, 2026; figures reconciled to the 8-K and the Q1 2026 10-Q). Re-verify against the latest filing before quoting at deadline.
Drawn from the substantive analysis in the case. Each angle is the headline; the case + model + crosswalk supply the reporting backbone.
A financial sponsor (KKR, Apollo, Blackstone, Brookfield) buying TMHC at 8.5x EV would face two constraints Berkshire does not: ~5x leverage on a cyclical homebuilder credit (which the rating agencies and banks will resist) and a five-to-seven-year hold period (which the homebuilder cycle does not cooperate with). Berkshire pays cash, holds forever. That combination is Berkshire’s structural advantage over the sponsor universe in homebuilder M&A — and the TMHC deal is the proof of concept. Case study pp. 9–10 walks the math.
Berkshire has owned Clayton Homes since 2003. Clayton Properties Group (site-built division) shipped ~10,000 site-built homes in 2025 — combined with TMHC’s 12,997 closings, Berkshire vaults from a modest site-built footprint to a top-10 U.S. production builder overnight. This is not an opportunistic single buy; it is the architecture of a platform. Case study pp. 9, 11.
Berkshire paid 1.08x book, 6.6x EBITDA, 8.7x earnings on FY2025 trough-cycle numbers (gross margin compressed 190 bps YoY, backlog down 41.8%, net orders down 9.6%). These are not 2021 multiples. The deal is the textbook Buffett move — a durable, simple business at a price that requires the seller to deliver merely normal operating performance for the buyer to do well. A practitioner reads the multiple as the cycle-call signal, not the price-tag. Case study pp. 6, 9, 12.
Drawn directly from the case-study analysis. Preferred attribution: “Phil Baratelli, Baratelli Institute.”
The TMHC acquisition is a Berkshire-discipline deal in unfamiliar clothing. The price is textbook; the industry is the surprise.
— Phil Baratelli, Baratelli Institute · on the May 31, 2026 deal announcement
Berkshire’s hold period is forever — or until a different opportunity appears. Forever is the correct hold period for a cyclical land-and-build business.
— Phil Baratelli, Baratelli Institute · on why a sponsor could not have bid this
1.08x book, 8.7x earnings, 6.6x EBITDA — these are not 2021 multiples. These are mid-cycle-trough multiples. Berkshire’s habit is to acquire at exactly this point in the cycle.
— Phil Baratelli, Baratelli Institute · on Berkshire’s price discipline
The clearest read is that Greg Abel is signaling a Clayton-Homes-plus-TMHC-plus-HomeServices site-built housing platform, not a one-off opportunistic buy.
— Phil Baratelli, Baratelli Institute · on the strategic frame
Sheryl Palmer stays. That single fact tells you this is the Buffett pattern — Tony Nicely at GEICO, Pete Liegl at Forest River, Greg Abel at BHE, Kevin Clayton at Clayton Homes. The textbook owner-operator alignment chapter.
— Phil Baratelli, Baratelli Institute · on the management-continuity signal
The cash absorbs ~2% of the $397 billion war chest. The cash-deployment problem at Berkshire argues for more of these deals, not fewer.
— Phil Baratelli, Baratelli Institute · on Berkshire’s next move
Pay a price that requires the seller to deliver merely normal operating performance for the buyer to do well. That is the third great Buffett principle, and TMHC is what it looks like in 2026.
— Phil Baratelli, Baratelli Institute · on margin-of-safety pricing
Every Berkshire Read case is a transaction. Every transaction gets funded from one of four asset-side places — one big balance that sits on the asset side of the balance sheet (cash), and three flows or trims the quarter delivers (OCF, capex, public-securities sales). Sitting alongside cash on the asset side is the ~$285B public-equity portfolio. And sitting behind both of those, on the liability side, are Berkshire’s two low-cost financings — insurance float and deferred tax liability — that combined to ~$266B at Q1 2026 and quietly fund the broader investment portfolio. The plain-English read: a Berkshire deal almost never has to choose, and the long-run compounding engine is the two low-cost financings sitting underneath the asset stack. The cards below explain each source the way Phil would explain it to a smart friend who isn’t in finance.
Our goal: make Berkshire’s cash and capital flows easier to follow than the source filings make them on their own — showing the river of cash-flow rollforward, and the running totals of cash, equity portfolio, float, and deferred tax liability — the full balance-sheet picture, with the math and the why. Work in progress — and we will try.
Mentoring at Scale.
Plain-English explanations first. Quarterly numbers below. Reader doesn’t need to be a CFA — just curious.
What it is. The actual money sitting in Berkshire’s account — mostly short-term U.S. Treasury bills. The famous “war chest” — and as of Q1 2026 (Greg Abel’s debut quarter), an all-time high.
Where it comes from. Sixty years of compounding operating profits the company chose not to spend.
How it deploys: totally unconstrained. Buffett can write the check tomorrow morning.
What it is. Insurance premiums Berkshire has collected but hasn’t yet paid out as claims. Berkshire invests it in the meantime.
Where it comes from. GEICO, Gen Re, and the reinsurance group — collected daily, paid out years later. Customers’ money, held legally.
How it works: free money to invest while it sits — regulator-constrained, not available for M&A.
What it is. Income tax Berkshire owes the IRS on unrealized gains in the equity portfolio (Apple, BAC, Coca-Cola, AmEx, Chevron). Not yet due, because the gains aren’t sold.
Where it comes from. The “Income taxes, principally deferred” line on the BRK balance sheet. An interest-free loan from the IRS, growing with the portfolio.
How it works: free leverage on the investment portfolio — becomes payable only when Berkshire sells.
What it is. The cash the businesses generated this quarter from operations — BNSF, BHE, GEICO, the manufacturing/service/retail group, the whole shop.
Where it comes from. Customers paying invoices, premiums coming in, railroads moving freight.
How it deploys: recurring. Shows up again next quarter, whether Berkshire spent any of it or not.
What it is. Cash raised when Berkshire trims or exits a publicly-traded stock position — the Apple trims of 2024 are the textbook recent example.
Where it comes from. Selling shares on the open market through Berkshire’s portfolio managers.
How it deploys: fully discretionary. Buffett chooses when, what, and how much.
The balance-sheet pill above shows the equity portfolio as a single number. Here is what makes it up. Five positions — Apple, American Express, Coca-Cola, Bank of America, Chevron — carry roughly two-thirds of the book. The newest name on the leaderboard is Alphabet, the first new tech position since Apple, profiled in Berkshire Read Case 3. Market values and weights are approximate, drawn from the Q1 2026 13F (holdings as of March 31, 2026); verify against the filing before quoting.
| Rank | Holding | Market value | % of equity book |
|---|---|---|---|
| 1 | Apple (AAPL) | ~$57.9B | ~22.0% |
| 2 | American Express (AXP) | ~$45.9B | ~17.4% |
| 3 | Coca-Cola (KO) · Read Case 6 → | ~$30.4B | ~11.6% |
| 4 | Bank of America (BAC) | ~$25.0B | ~9.5% |
| 5 | Chevron (CVX) | ~$17.5B | ~6.6% |
| 6 | Alphabet (GOOGL/GOOG) | ~$16.6B | ~6.3% |
| Alphabet — pro forma for the $10B June placement | ~$25.4B | ~9.3% | |
The first Alphabet line is the ~57.8M-share open-market stake (~$16.6B), the sixth-largest position. The highlighted pro-forma line counts Berkshire’s total committed Alphabet capital (~$25.4B) once the separate $10B June 2026 placement closes — which lifts the position above Chevron and roughly level with Bank of America, squarely inside the top five. Source: BRK Q1 2026 13F (filed ~May 16, 2026).
Kraft Heinz becomes the exclusive supplier of certain condiments, macaroni and cheese, and cream cheese at Disney’s North American parks, resorts, and Disney Cruise Line. Ten Kraft Heinz brands (including Heinz, Philadelphia, Kraft Mac & Cheese) also get Disney character-licensed retail treatments — Cinderella-branded mac and cheese, Jet-Puffed marshmallows featuring Olaf, themed condiment stations at the parks. The arrangement extends into Disney’s studios and streaming platforms with jointly-developed content.
Why it matters for Berkshire. Berkshire is Kraft Heinz’s largest shareholder (~27% of shares outstanding since the 2015 Kraft–Heinz merger — a ~$9–10B cost-basis position that has been an underperforming line in the equity portfolio for a decade). The Disney partnership positions Kraft Heinz into experiential commerce — parks, cruises, streaming — which is exactly the brand-loyalty and category-adjacency thesis the position was underwritten on. KHC stock traded up on the announcement.
The Baratelli WACC Reference publishes company-by-company cost-of-capital walkthroughs. Every Berkshire-adjacent name has its own page, with the practitioner note on what makes the calculation quirky — float and DTL for Berkshire, ownership dynamics for the holdings, Munger’s board seat for Costco.
Full S&P 500 WACC Reference → · Methodology · Snapshot 2026-06-30. Refreshed quarterly.
Buffett introduced “look-through earnings” in the 1990 shareholder letter to fix a blind spot in GAAP: Berkshire’s income statement only records the dividends it receives from its stock holdings, not the much larger profits those companies earn and retain on Berkshire’s behalf. Look-through earnings add the retained slice back in. The formula is simple:
Worked example from Case 3: a ~0.71% economic stake in Alphabet against ~$132B of net income is roughly ~$0.94B of look-through earnings — the real owner-economics of the position, most of which never appears on Berkshire’s own income statement. It is the lens the Institute uses to read every Berkshire equity position: own the earnings, not the ticker.
Every dollar these five companies earn gets used three ways: paid out as dividends, spent on buybacks, or retained inside the business. Berkshire benefits from all three — but only one shows up on its income statement. The table below lays out each company’s full-year 2025 figures and Berkshire’s estimated economic ownership; the column on the right is the look-through earnings that ownership represents.
| Holding | Net income | Dividends | Buybacks | Est. BRK ownership | BRK look-through earnings | BRK dividends received | BRK look-through buybacks |
|---|---|---|---|---|---|---|---|
| Apple (AAPL) | ~$112.0B | ~$15.4B | ~$89.3B | ~2.0% | ~$2.2B | ~$0.3B | ~$1.8B |
| American Express (AXP) | ~$10.8B | ~$2.3B | ~$5.3B | ~21.8% | ~$2.4B | ~$0.5B | ~$1.2B |
| Coca-Cola (KO) | ~$12.9B | ~$8.8B | ~$1.0B | ~9.3% | ~$1.2B | ~$0.8B | ~$0.1B |
| Bank of America (BAC) | ~$30.5B | ~$8.5B | ~$21.0B | ~7.0% | ~$2.1B | ~$0.6B | ~$1.5B |
| Chevron (CVX) | ~$12.3B | ~$12.3B | ~$11.7B | ~6.0% | ~$0.7B | ~$0.7B | ~$0.7B |
| Top-five total | ~$178.5B | ~$47.3B | ~$128.3B | — | ~$8.7B | ~$3.0B | ~$5.2B |
All figures full-year 2025, $ billions, approximate — verify against each company’s 10-K and Berkshire’s Q1 2026 13F before quoting. Ownership percentages are estimates from Berkshire’s reported share counts against each company’s shares outstanding (Apple ~300M shares; AXP 151.6M; KO 400M; BAC and CVX after 2025–26 trims). Look-through earnings = ownership % × net income; BRK dividends received = ownership % × dividends; BRK look-through buybacks = ownership % × buybacks. The three BRK columns are not additive — dividends and buybacks are funded out of the same net income that look-through earnings already captures in full, so summing them would double-count. Coca-Cola net income is GAAP; buyback figures are gross. Sources: Apple FY25 10-K; AXP, KO, BAC, CVX FY2025 results; BRK Q1 2026 13F.
Dividends are direct. Berkshire’s slice of the ~$47.3B these five paid out — roughly ~$3.0B — arrives as cash and is the only piece GAAP records on Berkshire’s income statement.
Net income is look-through. Berkshire’s economic share of the ~$178.5B these companies earned is about ~$8.7B — nearly three times the dividends. The difference is earnings retained and reinvested on Berkshire’s behalf, invisible to GAAP but real to an owner.
Buybacks compound silently. The ~$128.3B these five spent retiring their own shares lifts Berkshire’s ownership percentage every year — without Berkshire buying a single share or spending a dime. Coca-Cola at a fixed 400M shares has drifted from ~6% to ~9.3% of the company this way. It is the quietest of the three benefits and, over decades, often the largest.
All figures in $ billions. Cash, Equity Portfolio, Float, and DTL are end-of-quarter balances (stocks) — the four running totals. OCF, Public-Sec. Sales, and Capex are quarter activity (flows). Sourced from BRK quarterly financial reports (10-K, 10-Qs) and 13-F filings; DTL is the “Income taxes, principally deferred” line; equity portfolio is the aggregate quarter-end fair value of public-equity holdings. Last updated 2026-08-08 with Q2 2026 10-Q.
Plain-English orientation. The table is grouped to show the balance-sheet logic: ASSETS on the left (green — what BRK owns: cash and the public-equity portfolio) and LIABILITIES next to them (rose — float and DTL, what BRK owes at near-zero cost). The Cash + Equity Stack is partially financed by the liability stack (float + DTL); the remainder comes from Berkshire’s book equity (~$650B) and other liabilities. “OCF” = operating cash flow = the cash Berkshire’s businesses generated this quarter. “Capex” = capital expenditures at the operating subsidiaries. “DTL” = deferred tax liability = what Berkshire owes the IRS on unrealized capital gains in its equity portfolio (an interest-free IRS loan that grows with the portfolio). “Deployable subset” = the slice Abel is actually free to put to work after the $30B reserve and capex — excludes float and DTL (financing for the broader portfolio, not deal dollars) and excludes the equity portfolio itself (already invested).
| Quarter | ASSETS → what BRK owns | LIABILITIES → low-cost financing | FLOWS · this quarter | Deployable Subset Cash −$30B reserve +OCF +Sales −Capex =total | |||||
|---|---|---|---|---|---|---|---|---|---|
| 1. Cash + ST Treasuries (end) |
2. Equity Portfolio (end)¶ |
3. Float (end of qtr) |
4. DTL‡‡‡ (end of qtr) |
5. Operating Cash Flow |
6. Public-Sec. Sales (net) |
Less: Quarterly Capex† |
7. Deals◊ (named) |
||
| Q1 2024 | 189.0 | ~336¶ | ~168§ | ~92.0§§ | 10.6 | ~1.9 | (4.4) | — | ~$167 |
| Q2 2024 | 276.9 | ~284¶ | ~169§ | ~100.0§§ | 13.6 | ~75.5* | (4.5) | Apple trim~$75B (in Sales) | ~$332 |
| Q3 2024 | 325.2 | ~272¶ | ~170§ | ~95.0§§ | 1.8‡‡ | ~34.6* | (4.7) | Apple/BAC trim~$35B (in Sales) | ~$327 |
| Q4 2024 | 334.2 | ~272¶ | 266+ | 85.9 | 4.6 | ~5.0* | (5.4) | — | ~$308 |
| Q1 2025 | 347.7 | ~259¶ | ~172§ | ~85.5§§ | 10.9 | ~1.5* | (4.3) | Constellation init.~$1.2B | ~$325 |
| Q2 2025 | 344.1 | ~283¶ | 266+ | ~83.0 | 10.1 | ~3.0 | (4.8) | — | ~$322 |
| Q3 2025 | 381.7 | ~267¶ | ~175§ | 87.4 | 13.8 | ~5.7 | (5.6) | Alphabet entry~$5B (initial) | ~$366 |
| Q4 2025 | 373.3 | ~278¶ | 266+ | 87.0 | 11.2 | ~5.0 | (6.2) | Alphabet addbuild toward $15.6B | ~$353 |
| Q1 2026‡ | 397.4 | ~290¶ | 176.9 | 88.7 | 10.4 | ~8.0 | (5.0) | Delta init. ~$2.6B Alphabet tripled to $15.6B TMHC announced 5/31 (Q2’26) |
~$381 |
| Q2 2026‡‡‡‡ | 365.5 | 323.8¶ | 177.5 | 90.2 | 11.3 | (11.1) | (5.6) | Buyback restart $4.5B Alphabet into top 5 Tokio Marine treaty Apr 1 TMHC closed 7/24 (Q3’26) |
~$330 |
◊ Deals column shows named Berkshire transactions and equity-portfolio moves that Berkshire Read has analyzed (or will analyze). As new cases ship — Delta, Google, future M&A — they appear in the quarter they materially affected cash, float, or the equity portfolio. Deals are part of investment activity, not operating cash flow — they do not change the Deployable Subset formula (the formula already absorbs them via the Public-Sec. Sales and Cash columns). The column becomes part of the franchise mechanic: every case has a quarter and a dollar size in the rollforward. ¶ Equity Portfolio = aggregate market value of Berkshire’s public-equity holdings at quarter-end (Apple, American Express, Bank of America, Coca-Cola, Chevron, Kraft Heinz, Occidental, and the long tail). Figures sourced from BRK 13-F filings, 10-Q balance-sheet equity-securities line, and the equity-securities cost/fair-value disclosures in quarterly notes; market value fluctuates with both stock prices and Berkshire’s buy/sell activity, so all figures are flagged approximate (“~”). The Q2’24 step-down reflects the well-publicized Apple trim; the Q4’25–Q1’26 figures reflect continued BAC and Apple trimming alongside new Alphabet and Delta positions. * Q2’24–Q1’25 public-securities sales reflect the well-publicized Berkshire equity-portfolio trimming (notably Apple, which drove the Q2’24 figure; subsequent BAC trims drove later quarters). † Quarterly capex is the recurring sustaining-and-growth investment at the operating subsidiaries — BHE (~$2.5–3B/qtr), BNSF (~$1–1.5B/qtr), and the manufacturing/service/retail group (~$0.5–1B/qtr) — combined ~$4–6B per quarter, ~$19–21B annualized (FY2024 $19.0B, FY2025 $20.9B). It’s a real claim on cash that has to be funded before any dollar is “deployable” for M&A or buybacks. § Insurance float disclosed by BRK at year-end and mid-year (Buffett’s annual letter + Q2 commentary); intermediate-quarter figures are linearly interpolated estimates — flagged as such, not represented as primary-source verified. §§ DTL figures for Q1’24, Q2’24, Q3’24, Q1’25, and Q2’25 are approximate, reflecting the larger unrealized-gain swings around the Apple position peak and trims; verified year-end and last-three-quarter figures sourced directly from the BRK 10-K and 10-Q balance sheets (“Income taxes, principally deferred” line). ‡‡‡ DTL = Deferred Tax Liability — income tax Berkshire owes on unrealized capital gains in its equity portfolio. The liability becomes payable only when (and if) Berkshire sells. Until then, it functions as an interest-free loan from the IRS that grows with the portfolio — the second of Berkshire’s two low-cost financing sources alongside float. ‡‡ Q3’24 OCF was depressed by a $15.3B income-tax payment in the quarter (per BRK Q3’24 10-Q MD&A); 9M’24 OCF was $26.0B, which net of Q1’s $10.6B and Q2’s $13.6B leaves $1.8B for Q3’24. ‡ Q1 2026 = record-high $397.4B cash + short-term Treasuries ($58.1B cash & equivalents + $339.3B short-term U.S. Treasuries) — Greg Abel’s debut quarter as CEO (Jan 1, 2026 transition from Warren Buffett). Berkshire was a net seller of equities (~$24B sold, $16B purchased — $8B net) yet still initiated Delta (~$2.6B) and tripled Alphabet (to $15.6B); $235M in buybacks — Abel let the cash position grow. “Deployable Subset” equals Cash minus Buffett’s stated ~$30B minimum reserve, plus the quarter’s OCF, plus the quarter’s public-securities net sales, minus the quarter’s capex. Float and DTL are shown but deliberately excluded from this subtotal — they sit on the liability side of the balance sheet as low-cost financing for the broader investment portfolio, not as dollars available for the next acquisition. See the sidebar below for why. Sources: BRK Q1 2026 10-Q filed May 2, 2026 (1stqtr26.pdf; SEC EDGAR); BRK 2025 10-K filed Feb 2026 (EDGAR); BRK 2024 10-K filed Feb 22, 2025 (EDGAR); BRK 10-Qs for Q1’24 (EDGAR), Q2’24 (EDGAR), Q3’24 (EDGAR), Q1’25 (EDGAR), Q2’25 (EDGAR), Q3’25 (EDGAR); BRK Q2 2026 10-Q filed August 8, 2026 (2ndqtr26.pdf). Cash + Short-term Treasuries reported as combined per BRK convention. ‡‡‡‡ Q2 2026 — the deployment quarter. Cash + Treasuries dropped $32B QoQ (from record $397.4B Q1 peak to $365.5B) as Abel restarted the buyback ($4.5B in Q2), turned net BUYER of equities ($11.1B net purchases — H1 gross purchases $39.4B vs. sales $27.8B), and continued capex at $5.6B. Insurance float rose to $177.5B (+$1.1B YTD). DTL grew to $90.2B (+$3.2B YTD). Equity portfolio rose to $323.8B, with Alphabet crossing into the top 5 largest holdings alongside Apple, American Express, Bank of America, and Coca-Cola. The Tokio Marine 10-year quota-share reinsurance treaty took effect April 1, 2026 (BHRG new business). Taylor Morrison closed as a subsequent event on July 24, 2026 for ~$6.8B cash (Q3 2026 impact). PacifiCorp wildfire unpaid liability fell from $1.2B (year-end 2025) to $572M following the April 2026 Oregon Court of Appeals reversal of the Phase I verdict. Last verification pass: 2026-08-08.
Look at the table above. The left side (green) is the slice of what Berkshire owns that’s visible here: cash and the public-equity portfolio (the Cash + Equity Stack). The right side (rose) is the slice of what Berkshire owes that’s visible here: float and deferred taxes. This is not the full balance sheet — it excludes the wholly-owned operating businesses on the left, and book equity plus other liabilities on the right. It’s the slice that teaches the Buffett financing point.
The trick: those liabilities cost almost nothing. Most companies finance growth with debt at market interest rates. Berkshire’s two largest financings cost essentially zero — and most analyses of the company miss one of them entirely.
1. Float (~$178B). Customers’ insurance premiums Berkshire holds before claims are paid. As long as the insurance underwriting at least breaks even, the float is free money to invest. GEICO, Gen Re, and BHRG collect premiums daily; claims are paid out over years. Plain English: customers’ money, held legally, invested in the meantime. Q2 2026 note: the new Tokio Marine 10-year quota-share treaty (effective April 1, 2026) added $483M of premiums written in the first quarter alone.
2. DTL (~$90B). Income tax Berkshire owes the IRS on unrealized gains in its equity portfolio (Apple, American Express, Bank of America, Coca-Cola, and now Alphabet). Not due until Berkshire sells. So Berkshire essentially borrows from the IRS at zero interest, and the loan grows with the portfolio. Q2 2026: DTL grew $3.2B YTD as the equity portfolio expanded to $323.8B.
Combined: ~$268B of near-zero-cost financing sitting on the liability side. That’s what partially funds the Cash + Equity Stack — the rest is funded by Berkshire’s $747.9B of book equity as of June 30, 2026 plus other liabilities (claim reserves beyond float, modest debt at BHE/BNSF, deferred revenue, accruals). Without float + DTL, Berkshire would need ~$268B more equity capital — or it would have to take on real debt at market rates. Instead: ~$365B cash + ~$324B equity portfolio = ~$689B Cash + Equity Stack, with ~$268B of the right-hand financing coming from policyholders and the IRS at essentially zero cost. Note: this is only the liquid-investment slice of Berkshire’s balance sheet — it excludes the wholly-owned operating businesses (BNSF, BHE, GEICO ops, Marmon, Pilot, NetJets, See’s, Lubrizol, Precision Castparts, OxyChem [added January 2, 2026], Taylor Morrison [added July 24, 2026], and dozens more), which carry hundreds of billions more in assets.
Most companies finance growth with debt. Berkshire’s two largest financings are someone else’s money sitting on Berkshire’s balance sheet at near-zero cost. That’s the compounding engine the textbooks rarely explain.
Now that the four sources are on the table — float is properly excluded from the deal-funding pool, and the quarter’s capex is properly deducted — each Berkshire Read case lands against the truly deployable subset. Percentages are computed against the Q2 2026 deployable subset of ~$330B (down from the Q1 2026 peak of $381B as Abel deployed $4.5B in buybacks and $11.1B net into equities). The percentages are still tiny.
The Q2 2026 punchline. BRK’s genuinely deployable capital fell from a Q1 peak of ~$381B to ~$330B in Q2 — the first meaningful quarterly decline in the series. $365.5B in cash & short-term Treasuries (down $32B QoQ) minus Buffett’s ~$30B minimum reserve, plus $11.3B in Q2 operating cash flow, minus the $11.1B net equity buying (Berkshire was a net BUYER in Q2 — regime change from prior quarters), minus the $5.6B of quarterly capex. Float rose to $177.5B (+$1.1B YTD) with the new Tokio Marine treaty adding meaningful reinsurance premium. DTL rose to $90.2B (+$3.2B YTD) with the growing equity portfolio. Combined liability-side financing: ~$268B. TMHC (subsequent event, closed July 24 for $6.8B) is ~2.1% of the deployable subset. The buyback restart at $4.5B is ~1.4%. Alphabet’s full committed capital is ~7.7%. The deployment has begun; scale is still the story.
Berkshire publishes the inputs to all four sources quarterly — and the quarterly capex that has to come out before any dollar is truly deployable. Each Berkshire Read case lands as a line against the post-capex deployable subset. The point isn’t that individual deals are big — it’s that the river never stops, and the deployable subset alone is enough to make Berkshire’s biggest recent deals look like rounding errors.
The four-source view above shows the balances sitting on the balance sheet at the end of each quarter. This view shows the flows — the operating cash that came in each quarter and where it went. Two views, one story: the balances are the result; the flows are the engine.
Stocks above, flows below — both matter, neither alone is enough.
Quarter-end balances (the four-source table above) answer: how much could BRK theoretically pull from each pocket at the end of last quarter? Useful for sizing the war chest. Doesn’t tell you where the money came from or where it went.
Quarterly flow rollforward (the table below) answers: how much operating cash did BRK generate this quarter, and what did Buffett do with it? Useful for seeing the engine in motion. Doesn’t show the accumulated war chest.
Together they show what a real Berkshire Read needs: the standing reserves and the recurring inflows. Each Berkshire Read case is one line against both.
All figures in $ billions. Approximate — sourced from BRK 10-Q filings; recent quarters directional pending final filing.
| Quarter | Operating Cash Flow |
Capex (BNSF + BHE) |
Share Repurchases |
Net Equity Purchases |
Named M&A |
Net Cash After Uses |
|---|---|---|---|---|---|---|
| Q1 2024 | $10.0 | (4.4) | (2.6) | (1.9) | — | +1.1 |
| Q2 2024 | 12.2 | (4.7) | (0.3) | (3.8) | — | +3.4 |
| Q3 2024 | 10.9 | (4.6) | 0.0 | (34.6)* | — | (28.3) |
| Q4 2024 | 9.9 | (4.8) | 0.0 | (7.0)* | — | (1.9) |
| Q1 2025 | 10.7 | (4.5) | 0.0 | (1.5)* | — | +4.7 |
| Q2 2025 | 11.5 | (4.6) | 0.0 | (0.5) | — | +6.4 |
| Q3 2025 | 11.8 | (4.7) | 0.0 | +2.0 | — | +9.1 |
| Q4 2025 | 11.2 | (4.8) | 0.0 | +1.0 | — | +7.4 |
| Q1 2026 | 10.4 | (3.2) | (0.2) | +0.5 | OxyChem (9.4)‡‡‡‡ |
(1.9) |
| Q2 2026‡‡‡‡ | 11.3 | (3.5) | (4.5) | (11.1)* | — | (7.8) |
| 10-quarter total | ~$110.0 | ~(48.0) | ~(7.6) | ~(59.6) | ~(9.4) | ~(14.6) |
* Q3’24–Q1’25 net equity purchases reflect the well-publicized Berkshire equity-portfolio trimming (notably Apple). Q2’26 net equity purchases of $(11.1)B is a regime change — Berkshire was a net BUYER of equities in Q2 2026 (H1 purchases $39.4B vs. sales $27.8B), running at 5.5x the prior-year pace. Alphabet crossed into the top 5 largest holdings alongside Apple, American Express, Bank of America, and Coca-Cola. Combined with the $4.5B buyback restart (first meaningful repurchase quarter in almost two years), Q2 2026 was the largest cash-deployment quarter of Abel’s tenure to date. ‡‡‡‡ Q1 2026: OxyChem closed January 2, 2026 for ~$9.4B cash (a subsequent-event acquisition from Occidental Petroleum — not yet reflected in the December 31, 2025 balance sheet, but consumed cash in Q1). Q2 2026: Buyback restarted at $4.5B (weighted-average Class B repurchase price ~$476–488, weighted-average Class A ~$716K–734K). TMHC subsequently closed July 24, 2026 for ~$6.8B cash (Q3 impact). Source: BRK Q2 2026 10-Q filed August 8, 2026 (2ndqtr26.pdf); BRK 10-Q quarterly filings.
A second lens: each case sized purely against the ~$11.5B quarterly operating cash flow. This is the engine in motion — the recurring number that shows up again next quarter whether Buffett spent a dollar of it or not.
Berkshire publishes operating cash flow quarterly. Each Berkshire Read case lands as a line on this rollforward. The point isn’t that individual deals are big — it’s that the river never stops.
Every Berkshire-relevant news cycle gets a Case (if it’s a real move) or a Brief (if it’s a pattern test). The franchise publishes when the analysis is ready — not on a calendar schedule, and not on a turnaround clock. We’d rather be late and right than fast and shallow. Six Cases are live; here’s what’s published and what’s in queue.
The franchise now spans an $8.5B acquisition and four equity-stake reads: Taylor Morrison (TMHC), the $8.5B all-cash flagship; Delta Air Lines (DAL), the contrarian airline re-entry; Alphabet (GOOGL), the first tech Read after Apple; and Coca-Cola (KO), the 37-year permanent holding. Each ships with a case study, IC memo, 3-statement model, and deck — all free.
Status: live now · browse all cases →
Working journalists are the Berkshire Read franchise’s primary readership. The Institute publishes for the journalist who has 30 seconds to verify the source, 5 minutes to extract a usable pull-quote, and 15 minutes to download a press kit before filing. Below is everything you need.
The Three Masters’ Library is the free companion — the books Buffett, Munger, and Ackman actually read, annotated with why each one matters and in what order, with reader paths for different goals. The bibliography behind every Berkshire Read; yours at no cost. Free.
Want a classic in full? The Reading Room hosts public-domain texts on money and markets, complete and free — starting with Carnegie’s Gospel of Wealth.
First Principles of Master Investing is the show-the-math synthesis behind every Berkshire Read — how Buffett, Munger, Ackman, and the Outsiders CEOs actually reason, each principle paired with a named case and an intrinsic-value walk. Where the reading list gives you the books, this gives you the method. A window into the analytical method, if you want it — not a step you have to take. $99 introductory ($249).
TMHC_Press_Kit.zip · ~1.2 MB. Includes all 7 TMHC case files, the 1-page About summary, embargo & republication terms, high-res author photo, and Institute wordmark (SVG + PNG).
What the Berkshire Read is, who Phil is, how to reach for follow-up. About the Berkshire Read (PDF).
Quote, paraphrase, link freely. Wholesale PDF republication requires written approval. Embargo & republication terms (PDF). Preferred attribution: “Phil Baratelli, Baratelli Institute.”
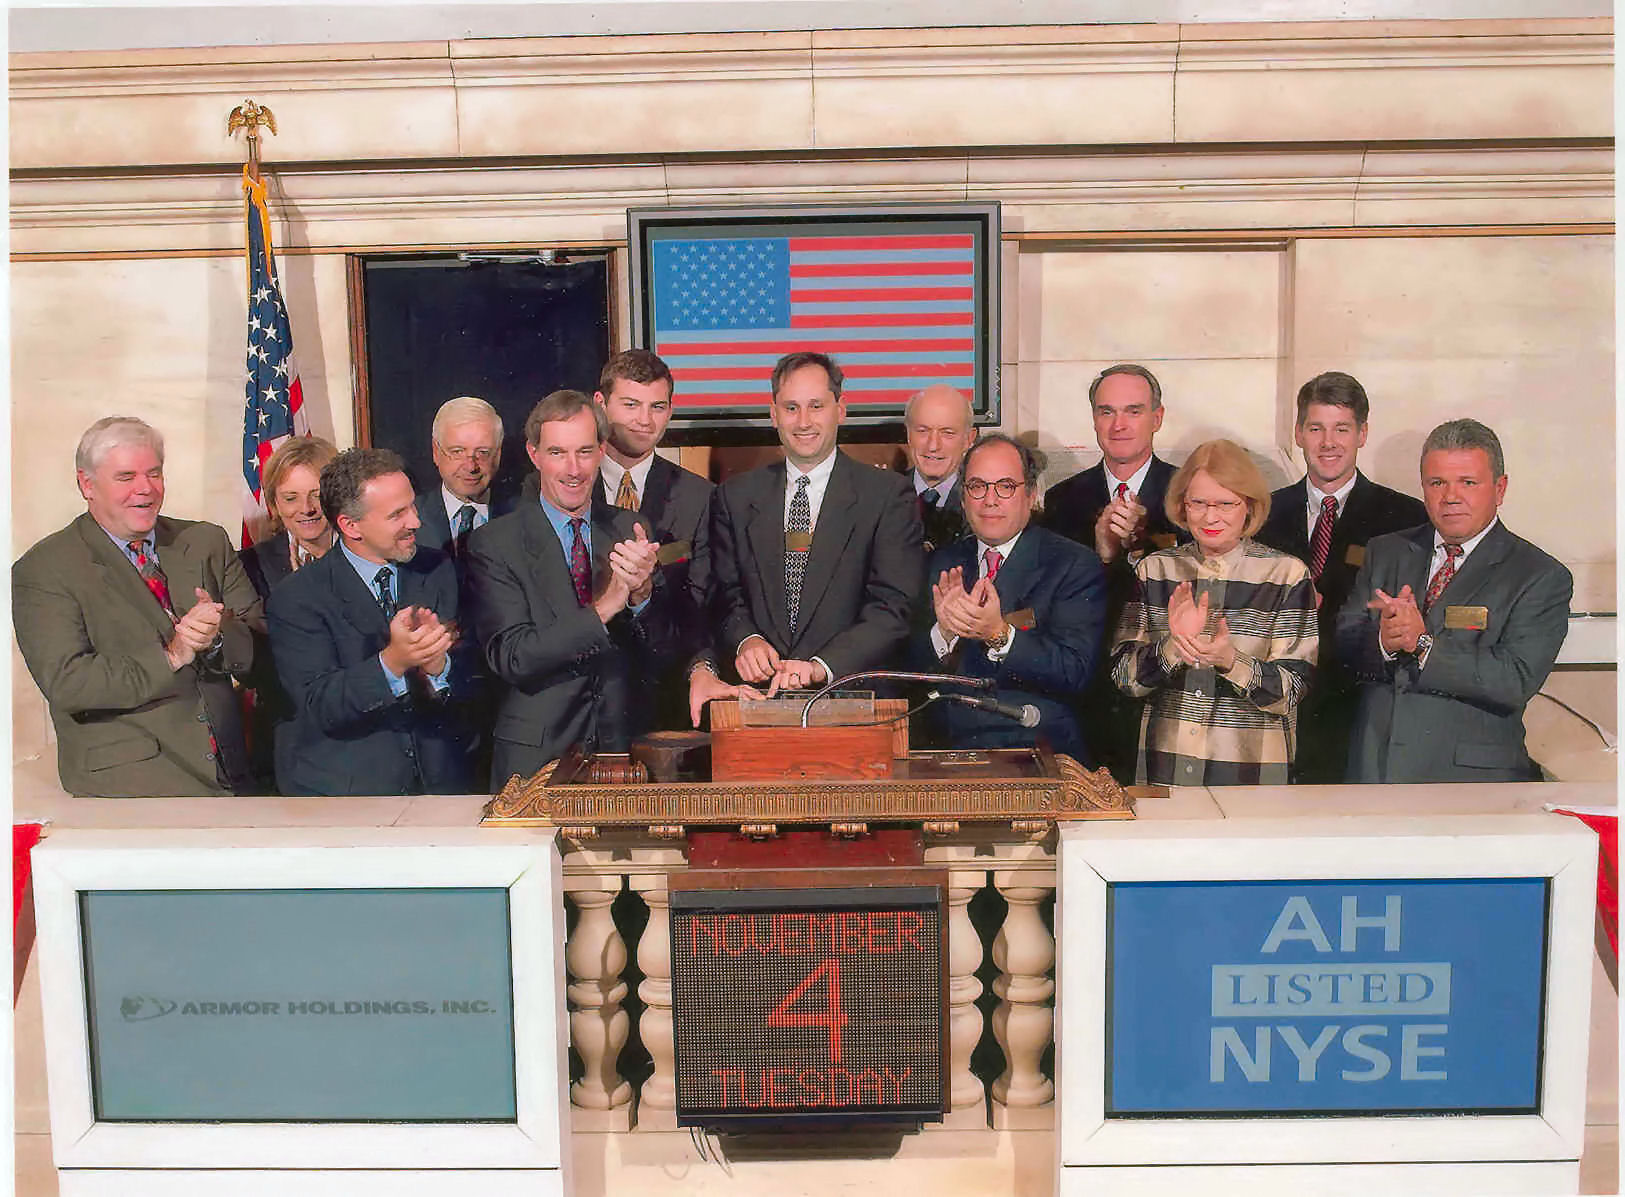
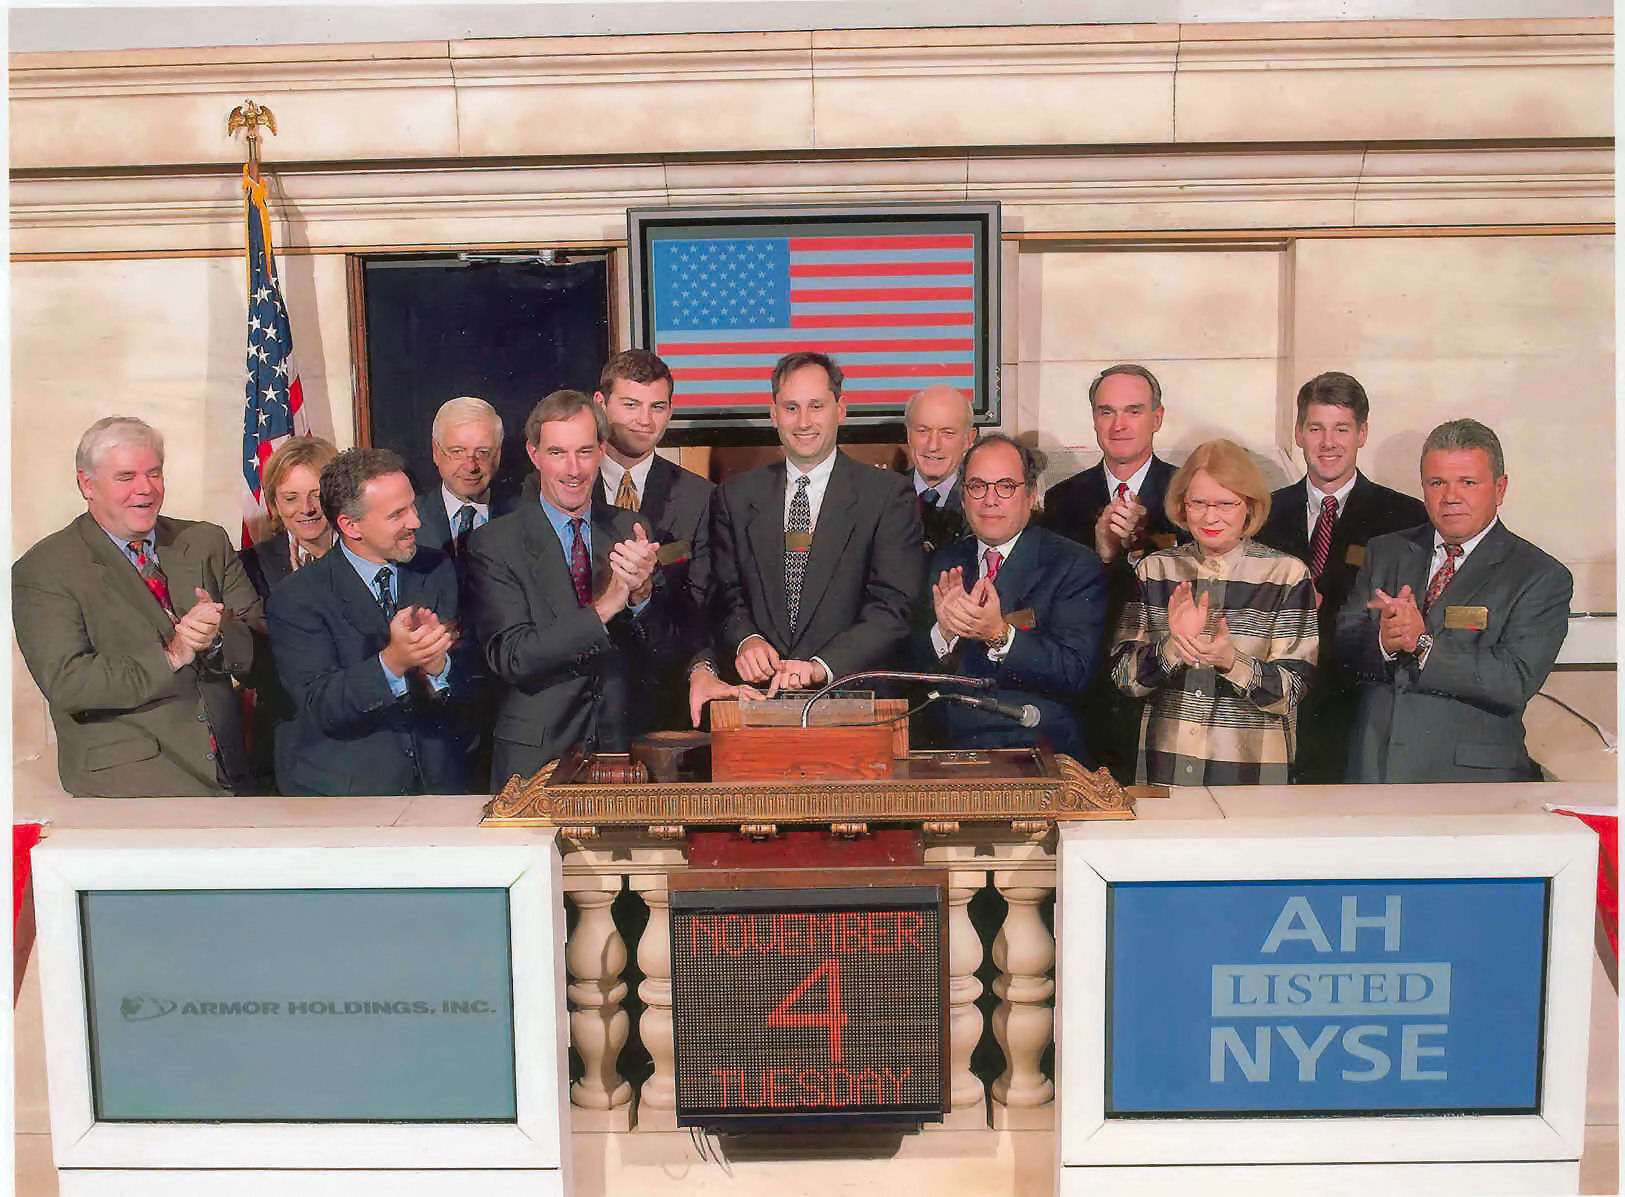
Phil_Baratelli_NYSE_Bellringer_HighRes.jpg · ~325 KB. Phil ringing the NYSE Closing Bell, November 4, 2003, as Corporate Controller and Treasurer of Armor Holdings, Inc. (NYSE: AH).
Vector: Baratelli_Institute_Wordmark.svg · Raster: Baratelli_Institute_Wordmark.png. Use either for editorial layout; SVG scales cleanly.